Course Objectives
How to approach ML problems
Types of common ML problems and gotchas
Understand differences between single node and distributed ML
Identify new ML use cases
What is ML?
Learning patterns in your data without being explicitly programmed
Function that maps features to an output
Types of Machine Learning
Supervised Learning
Unsupervised Learning
Reinforcement Learning
Supervised Machine Learning
Classification
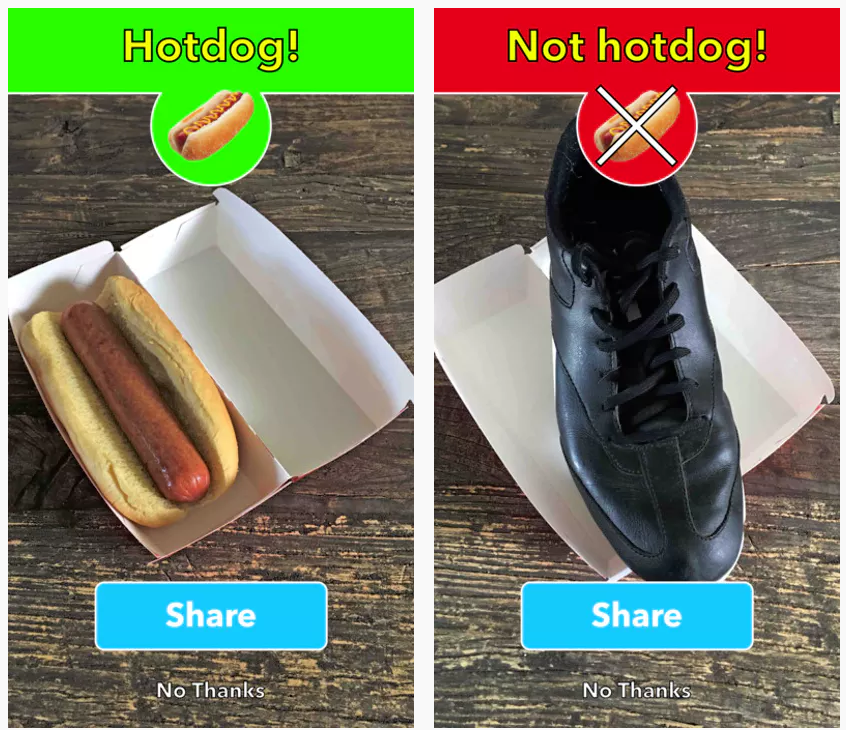
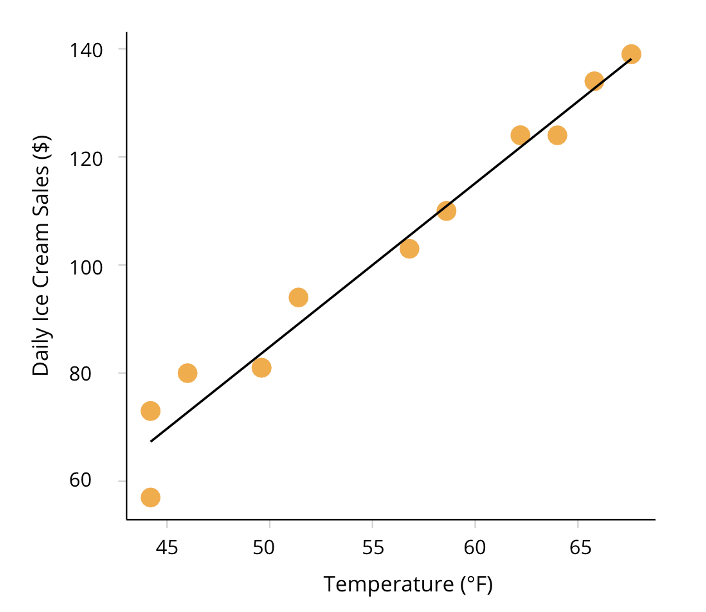
Regression
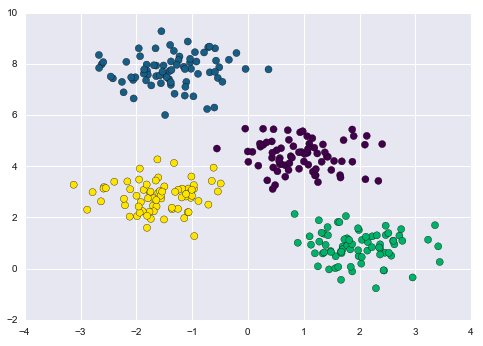
Unsupervised Machine Learning
Learn structure of the unlabeled data
Reinforcement Learning
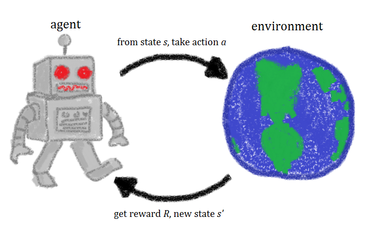
Learning what to do to maximize reward
Explore and exploit
Business Use Cases?
Defining Success
What if I told you I had a model that was 99% accurate in predicting brain cancer?
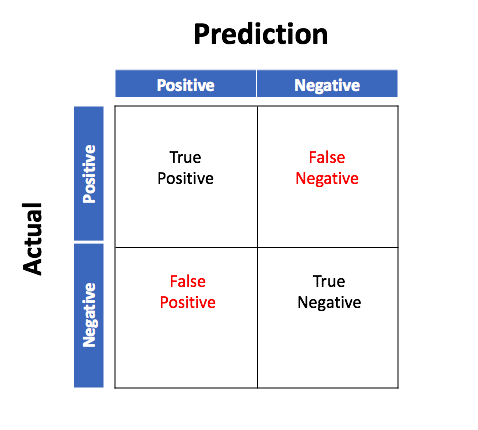
Which Metric is Important?
Baseline Model
You ALWAYS want to have a baseline model to compare to
This should be a "dummy" model, i.e. a coin flip
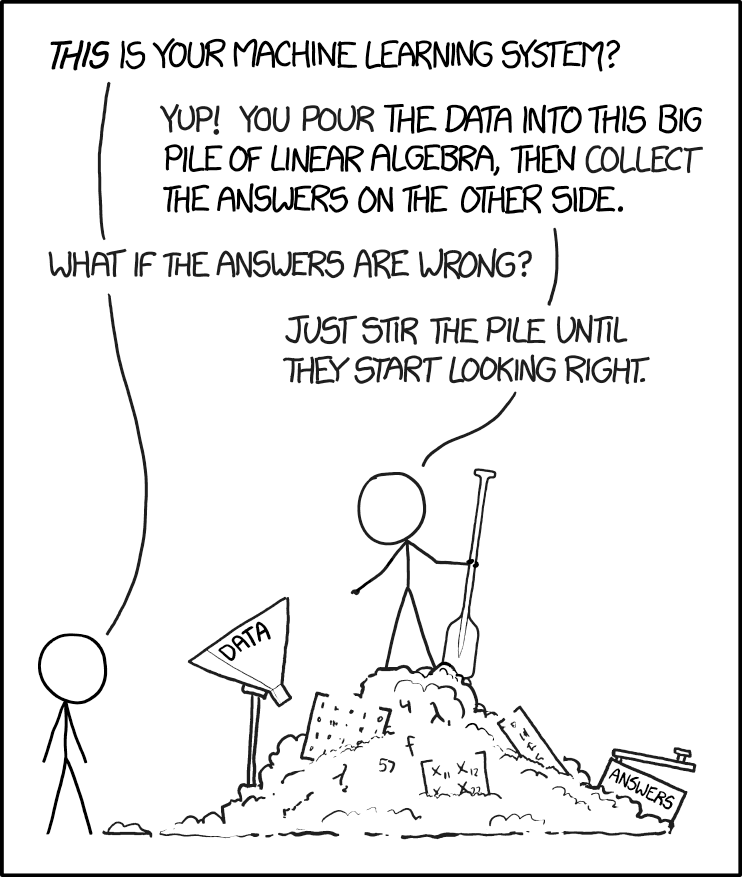
All models are wrong; some models are useful.
Model Selection?
Underlying data distribution
Deployment considerations
Some models are more costly to train
Need for interpretability?
Right to Explanation
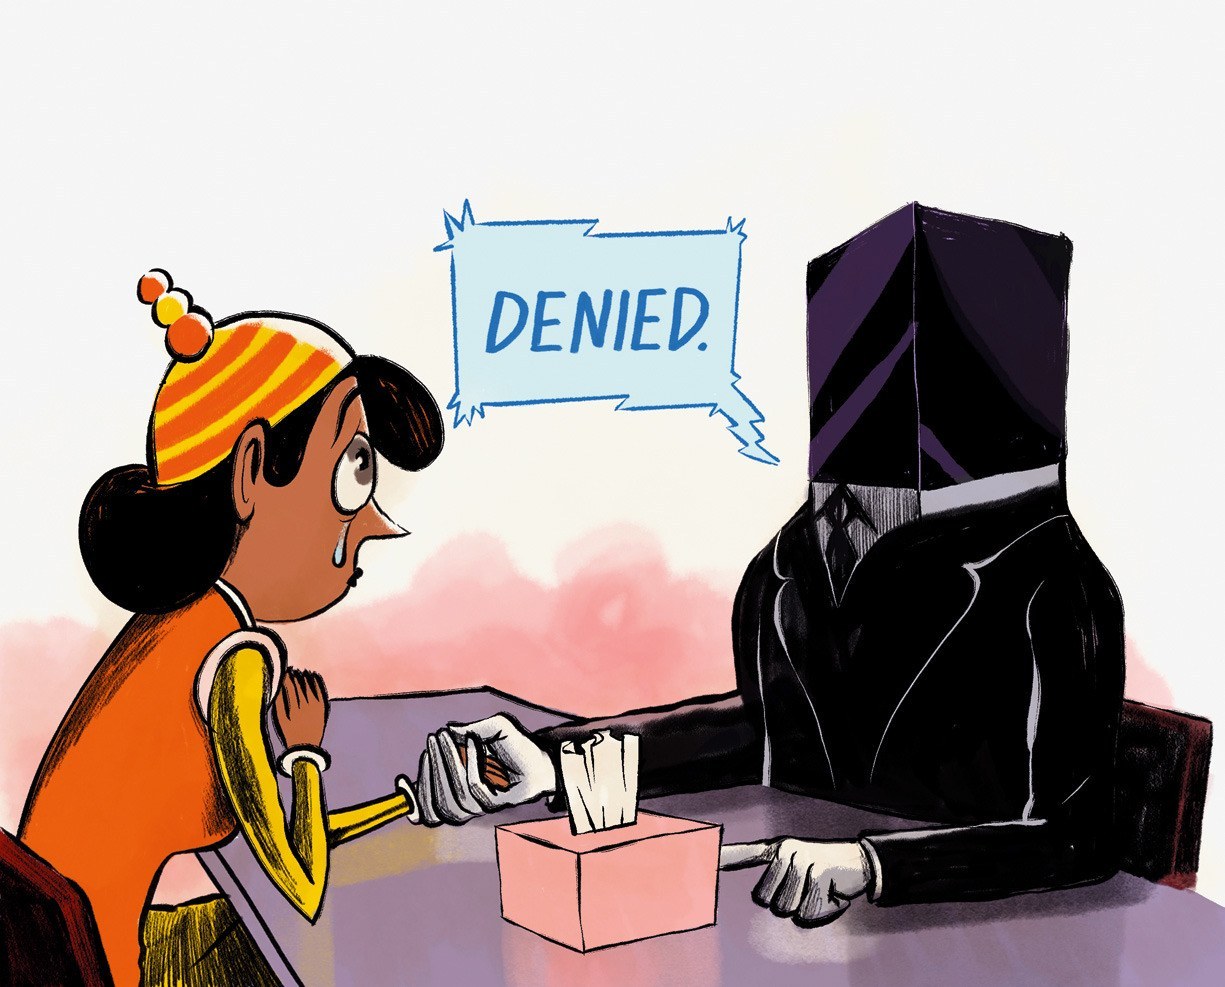
General Data Protection Regulation
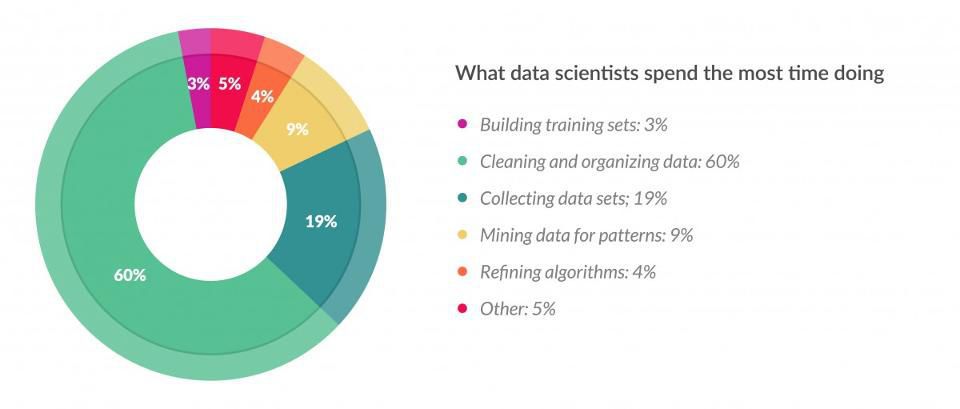
The Dirty Work of a Data Scientist
Why visualize your data?
Anscombe's Quartet
| Dataset #0 | Dataset #1 | Dataset #2 | Dataset #3 | |||||
|---|---|---|---|---|---|---|---|---|
| x | y | x | y | x | y | x | y | |
| 10 | 8.04 | 10 | 9.14 | 10 | 7.46 | 8 | 6.58 | |
| 8 | 6.95 | 8 | 8.14 | 8 | 6.77 | 8 | 5.76 | |
| 13 | 7.58 | 13 | 8.74 | 13 | 12.74 | 8 | 7.71 | |
| 9 | 8.81 | 9 | 8.77 | 9 | 7.11 | 8 | 8.84 | |
| 11 | 8.33 | 11 | 9.26 | 11 | 7.81 | 8 | 8.47 | |
| 14 | 9.96 | 14 | 8.1 | 14 | 8.84 | 8 | 7.04 | |
| 6 | 7.24 | 6 | 6.13 | 6 | 6.08 | 8 | 5.25 | |
| 4 | 4.26 | 4 | 3.1 | 4 | 5.39 | 19 | 12.5 | |
| 12 | 10.84 | 12 | 9.13 | 12 | 8.15 | 8 | 5.56 | |
| 7 | 4.82 | 7 | 7.26 | 7 | 6.42 | 8 | 7.91 | |
| 5 | 5.68 | 5 | 4.74 | 5 | 5.73 | 8 | 6.89 | |
| Regression | ||||||||
| Dataset #1 | Dataset #2 | Dataset #3 | Dataset #4 | |||||
|---|---|---|---|---|---|---|---|---|
| Mean | 9 | 7.5 | 9 | 7.5 | 9 | 7.5 | 9 | 7.5 |
| Variance | 11 | 4.1 | 11 | 4.1 | 11 | 4.1 | 11 | 4.1 |
| Correlation | 0.86 | 0.86 | 0.86 | 0.86 | ||||
| Regression line |
y = 3 + 0.5x | y = 3 + 0.5x | y = 3 + 0.5x | y = 3 + 0.5x | ||||
Why Visualize Your Data?
